01 Jun This is how to calculate test scores in Comproved
Comproved’s comparing tool works according to the method of comparative judgement. With this method, each assessor is presented with multiple pairs of products and for each pair they have to indicate the better product of the two. Based on all the choices made by the different assessors, the tool ranks the products. This ranking can eventually be converted into test scores. We explain how that works in this article.
During an assessment, the comparing tool offers each product several times in different pairs to different assessors. For each pair, each assessor chooses what they think is the best product in the pair, in the light of the competence to be assessed. This produces a lot of data on which the tool performs a Rasch analysis, more specifically according to the Bradley-Terry-Luce model.
This analysis produces quality scores. These scores can be found in the tool under ‘ability’ and often range from -3 to +3. These abilities express a chance that the product would ‘win’ in a comparison with a product with an ability value of 0. For example, a product with an ability of 2 has more than a 90% chance of winning in a comparison with a product with an ability of 0. Comproved offers the possibility to convert these quality scores into grades, in which case we speak of test scores.
Why test scores in Comproved?
When an assessment is finished, product quality scores are reliably estimated. However, quality scores in themselves are difficult to interpret and report. After all, they are not relative to a maximum score or a norm. It is therefore not possible to compare the quality scores of an assessment with those of another assessment. For example, a product A with a quality score of 1.5 in an assessment X may result in a test score of 6/10, while the same quality score of 1.5 for a product B in an assessment Y may result in a test score of 8/10.
How to determine test scores?
An illustration: For an assessment X, a teacher wants to determine a grade out of 10. The quality scores of the assessment must then be converted into test scores on a scale of 0 to 10. To do this, the teacher will select two anchor points after the assessment is finished, that is when all comparisons have been made. A rule of thumb to determine these anchor points is to select a product at 1/3 of the ranking (high quality) and a product at 2/3 of the ranking (low quality) and to ensure that the quality scores differ by about 2 abilities (e.g. a product with ability 1.59 as high and a product with ability -1.08 as low). These anchor points should be assigned a grade or test score by consensus.
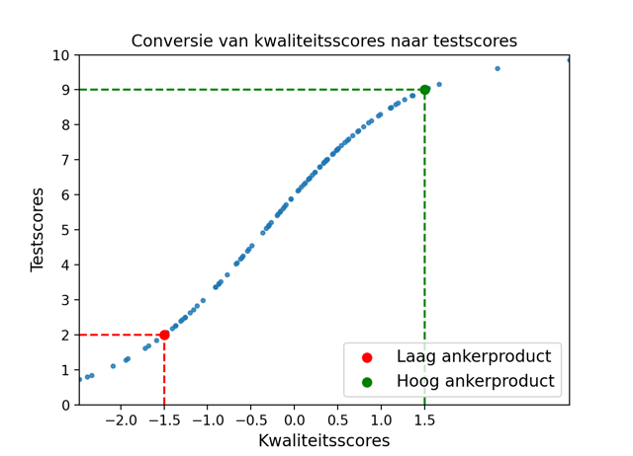
In the example, the assessors decided by consensus that the anchor product with a quality score of -1.5 should be given a test score of 2/10. The anchor product with a quality score of 1.5 gets a test score of 9/10. Based on the assigned test scores for the anchor products, the tool can then derive the test scores of all other products. The figure below shows how the quality scores are transformed into the test scores on a scale from 0 to 10. This transformation is based on the method of Fair Averages as proposed by Linacre.

Note how the test scores are non-proportional (no linear relationship) to the quality scores. For example, when the quality score rises from 0 to 1.5 then the test score rises about 3 points. But when the quality score rises from -1.5 to 0 then the test score rises about 4 points. We can guarantee that the test scores are accurate as long as the given test scores for the anchor products are correct. Comproved recommends that assessors determine test scores for the anchor products by mutual agreement.
Can you compare rankings of different assessments using the test scores?
It is possible to combine the test scores of different assessments by calibrating the test scores. This is only possible when the assignment in the assessments is the same. That is, when the same competence is assessed, the reliability of the individual rankings is high enough (>.70) and anchor points are included.
An example: In an assessment A, a competency X is assessed. In assessment B, the same competency X is assessed. Assessment B could, for example, be a new measurement moment at a later date with the same students, or the same assessment in a different class. You could now link these two rankings. To do this, you include two anchor points from assessment A in assessment B. Assessment B then consists of all students’ works from assessment B + the two anchor points from assessment A.
You then determine the test scores in assessment A. In this way, the anchor points also receive a test score. When determining the test scores in assessment B, you give the anchor points the same scores as in assessment A. That way, the norm from assessment A is transferred to assessment B and you can compare the ranks based on the test scores. You could also merge the rankings into one ranking based on those test scores.


